
Loan Originator, NMLS# 513013 · August 10, 2026
August’s finalized Austin–Round Rock–San Marcos data shows a slower market, not a stopped one: 2,501 residential sales, a $412,000 median price, 13,676 active listings, and 5.1 months of inventory. Compared with August 2025, sales fell 7.3% and the median fell 6.4%, while pending sales rose 1.5%.
If you only read the national housing headlines, Austin can sound either frozen solid or ready to take off. Neither description fits what I’m seeing. This market is more normal—and more neighborhood-specific—than it has been in years. Good homes still move. Overpriced homes sit. Buyers are doing the math.
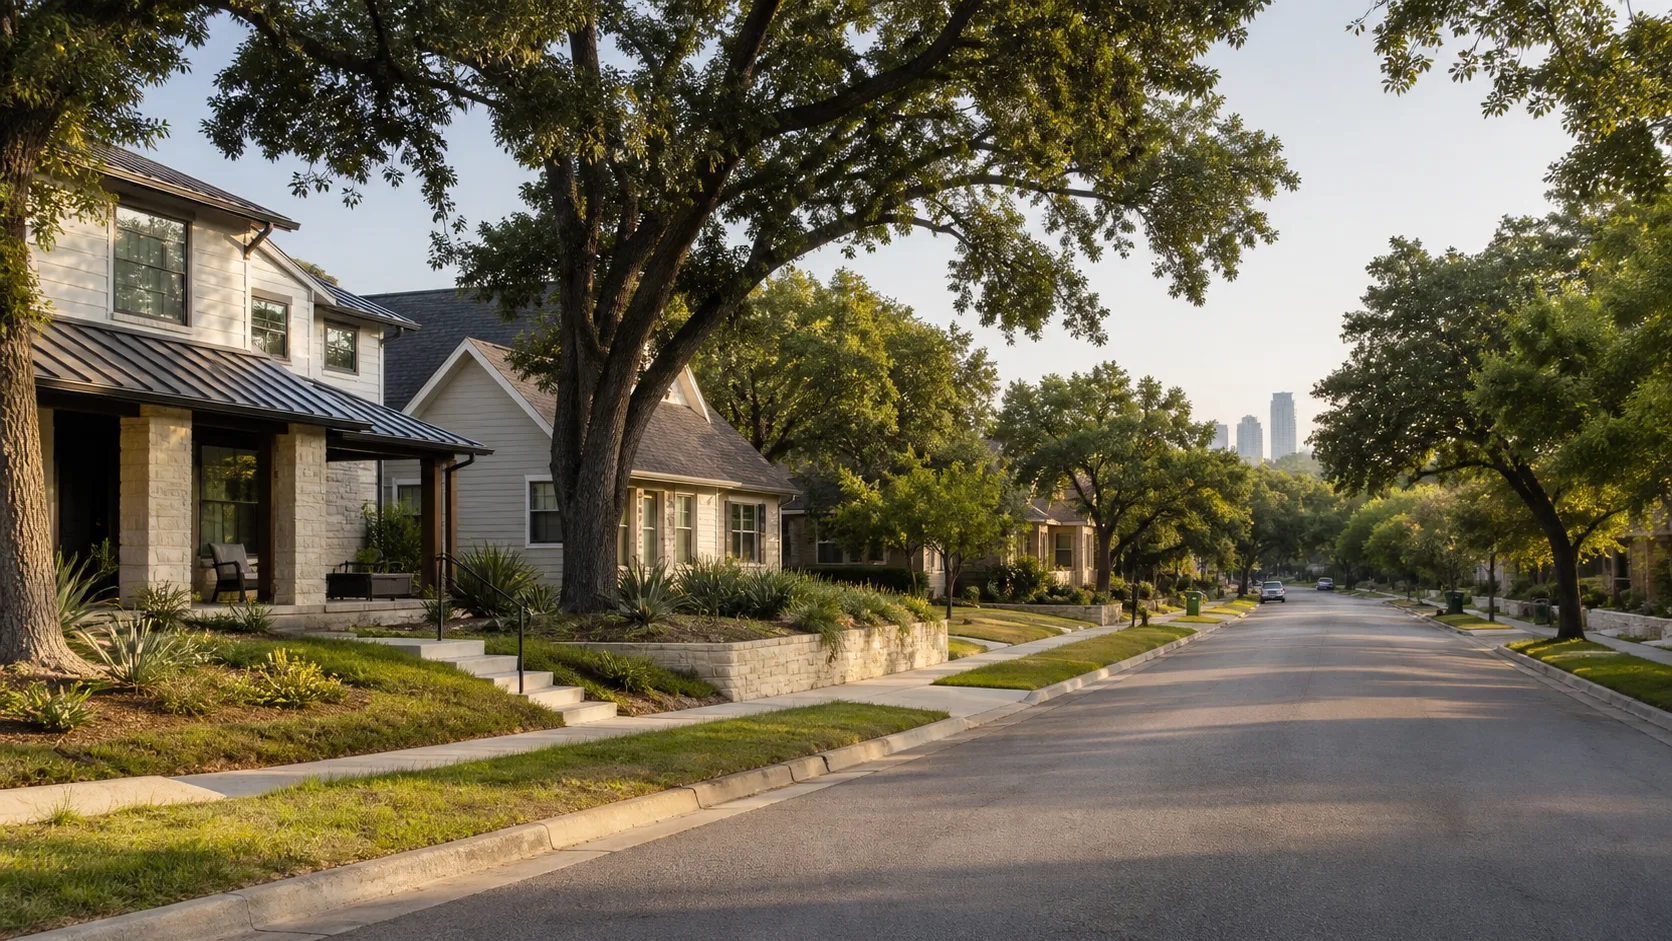
This report now uses the finalized August 2026 Central Texas Housing Report from Unlock MLS. For rate context, it uses Freddie Mac’s national weekly benchmark for October 1, 2026. That benchmark is dated context—not a rate quote for a specific borrower.
On this page
What Are Mortgage Rates in Austin Right Now?
Freddie Mac’s Primary Mortgage Market Survey reported a 7.28% national average for a 30-year fixed mortgage for the week ending October 1, 2026. That was up from 7.03% the prior week and 6.34% a year earlier. The 15-year fixed averaged 6.60%, up from 6.42% the week before.
PMMS is a national benchmark based on mortgage applications submitted through Freddie Mac’s Loan Product Advisor. It is not a promise that an Austin borrower will receive 7.28%. Actual pricing depends on credit, down payment, occupancy, loan type, property, points, and market movement between quote and lock.
My take: I would rather give someone a boring payment that works than a clever story about where rates might go. Build the purchase around what you can carry today. If rates improve later, a refinance may help—but that is a bonus, not the plan holding the deal together. Once you are under contract, compare locking and floating with real dollars, not a rate forecast.
Austin Home Prices: What Does the Latest MLS Report Show?
In August 2026, the Austin–Round Rock–San Marcos MSA recorded a $412,000 median sold price, down 6.4% from August 2025. The metro closed 2,501 residential sales, down 7.3% year over year, while pending sales rose 1.5% to 2,623.
A monthly median describes the mix of homes that closed; it does not tell you what a specific house gained or lost. Use current neighborhood and price-band comparables when making an offer or setting a list price.
| Metric | Latest verified figure | Year-over-year change |
|---|---|---|
| Median sold price | $412,000 | −6.4% |
| Closed sales | 2,501 | −7.3% |
| Active listings | 13,676 | −6.5% |
| Pending sales | 2,623 | +1.5% |
| Months of inventory | 5.1 months | −0.4 month |
| Average close-to-list price | 93.2% | 92.2% in August 2025 |
| 30-year fixed PMMS | 7.28% (Oct. 1) | 6.34% one year earlier |
Housing figures are August 2026 Austin–Round Rock–San Marcos MSA MLS-only data from Unlock MLS. Mortgage rates are the Freddie Mac national weekly average for the week ending October 1, 2026.
Is Austin a Buyer’s Market or a Seller’s Market?
The data does not support a one-word answer across every price point and neighborhood. At 5.1 months of inventory, buyers generally have room to inspect, compare, and negotiate. Active listings were down 6.5% from a year earlier, while pending sales were up 1.5%.
The average close-to-list ratio was 93.2%. That does not mean every buyer received a 6.8% discount; it is an aggregate across the metro and can reflect price reductions made before contract. It does tell us that original asking prices and final sale prices were not the same on average.
Practical translation: you have permission to negotiate, not permission to throw a random lowball at every house. Ask your agent for recent comparable sales, listing history, and days on market for the exact home. A stale listing with two price cuts is a different conversation from a clean, well-priced home that hit the market Friday.
What Does the August Market Mean for Austin Buyers?
1. Get fully pre-approved before writing
A pre-approval should be based on documented income, assets, credit, and the actual loan program—not a calculator that congratulates everyone. This matters even more for self-employed, 1099, K-1, commission, or rental-property income, where the qualifying calculation can look nothing like the number in your head.
2. Compare concessions against price
A seller credit may reduce cash due at closing or pay for a rate buydown, subject to loan-program limits. Sometimes that helps more than an equal price reduction; sometimes it does not. Run both versions using the same loan assumptions and expected time in the home.
3. Treat 7.28% as a dated benchmark, not your quote
The Freddie Mac number is useful for direction and context. For a decision, request a written Loan Estimate or detailed fee worksheet showing rate, points, lender credits, third-party costs, and cash to close.
What Does the August Market Mean for Austin Sellers?
Demand did not disappear: August pending sales were 1.5% higher than a year earlier. But closed sales fell 7.3%, and the 93.2% close-to-list ratio shows why pricing discipline matters. Buyers facing an elevated national mortgage-rate benchmark are payment-sensitive.
A strong listing strategy starts with recent sold comparables, current competition, and a realistic view of condition. If a concession is on the table, evaluate its net cost beside a price adjustment rather than treating either option emotionally.
Austin Housing Market FAQ — August 2026
What is the median home price in Austin right now?
Unlock MLS reported a $412,000 median sold price for the Austin–Round Rock–San Marcos MSA in August 2026, down 6.4% from August 2025.
How many homes are for sale in the Austin metro?
Unlock MLS reported 13,676 active residential listings in August 2026, down 6.5% from August 2025.
What mortgage-rate benchmark does this report use?
Freddie Mac’s national 30-year fixed benchmark averaged 7.28% for the week ending October 1, 2026. It is a dated national benchmark, not an individual Austin quote; pricing varies by borrower, property, loan structure, points, and timing.
Is Austin a buyer’s market in August 2026?
The metro had 5.1 months of inventory in August 2026. That can give buyers room to compare and negotiate, but conditions vary by neighborhood, price band, property condition, and days on market.
Should I wait for mortgage rates to fall?
No one can verify a future rate path. Buy only if the current payment, cash requirement, and ownership plan work now. A future refinance may be possible, but it is not guaranteed.
Want the numbers for your specific scenario? I can compare purchase price, down payment, seller credits, and rate options side by side. Get pre-approved, send your scenario, or call (512) 956-6010.
Sources: Unlock MLS, August 2026 Central Texas Housing Report, released September 15, 2026; Freddie Mac Primary Mortgage Market Survey archive, week ending October 1, 2026.
Mortgage rates and terms vary by borrower and may change without notice. This information is for educational purposes and is not an offer to extend credit or a commitment to lend. All loans are subject to underwriting approval; not all applicants qualify.
Adam Styer
Adam Styer | HyperSmart Home Loans
NMLS# 513013 | (512) 956-6010
Have questions? Want to know what your options look like right now? Give me a call or shoot me a text. Happy to run the numbers for you.
Talk soon,
Adam Styer
Adam Styer | HyperSmart Home Loans
NMLS# 513013 | (512) 956-6010